Project Analysis
The Acumen Fuse analysis engine uses a combination of ribbons and metrics to run project analytics.
In addition to calculating metrics, Acumen Fuse analysis also determines whether or not defined tripwire thresholds have been triggered.
You can use the Activity Browser to pinpoint which activity(s) are causing the metric tripwire to trigger. The Activity Browser shows activities based on which ribbon, phase, or intersection you click on.
The Acumen analysis engine can analyze across multiple phases as well as segment data by ribbon. The analysis engine automatically calculates duration, cost, and work across phase boundaries and spreads values accordingly.
For example, a 60-day activity starting on January 1 will automatically be segmented into 31 days in January, 28 days in February (assuming a non-leap year), and 1 day in March. The costs and work for this activity also get spread accordingly so that when the metric engine is run, results are not only analyzed for the ribbon as a whole but also within each individual phase.
Similarly, the engine determines, for example, within which phase an activity starts. This in turn enables metrics, such as the number of activities starting within a particular fiscal reporting period, to be created.
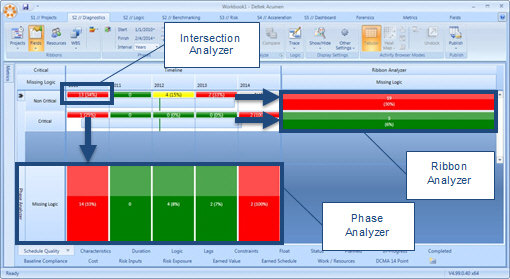
Project Analysis Example
- The ribbon analyzer tells you which group of activities (Critical or Non-Critical) has missing logic.
- The phase analyzer tells you which time period contains the activities with missing logic.
- The intersection analyzer pinpoints the path and phase.